Now that we successfully fetched all the data we need, it’s time to start building the interface.
Let’s add an Express server to serve a blank HTML page, in the / path:
const express = require('express')
const app = express()
app.set('view engine', 'pug')
app.set('views', path.join(__dirname, 'views'))

app.get('/', (req, res) => res.render('index'))
app.listen(3000, () => console.log('Server ready'))
and we create a views/index.pug file, with this content:
html
  body
Before this can work we must npm install Pug:
npm install pug
or add it to the package.json file in Glitch.
If you’re unfamiliar with Pug, it’s the version 2 of Jade. Before going on, find and read my introduction at flaviocopes.com/pug.
We’re ready to design the basic UI!
Remember the mockup I posted in the first lesson?
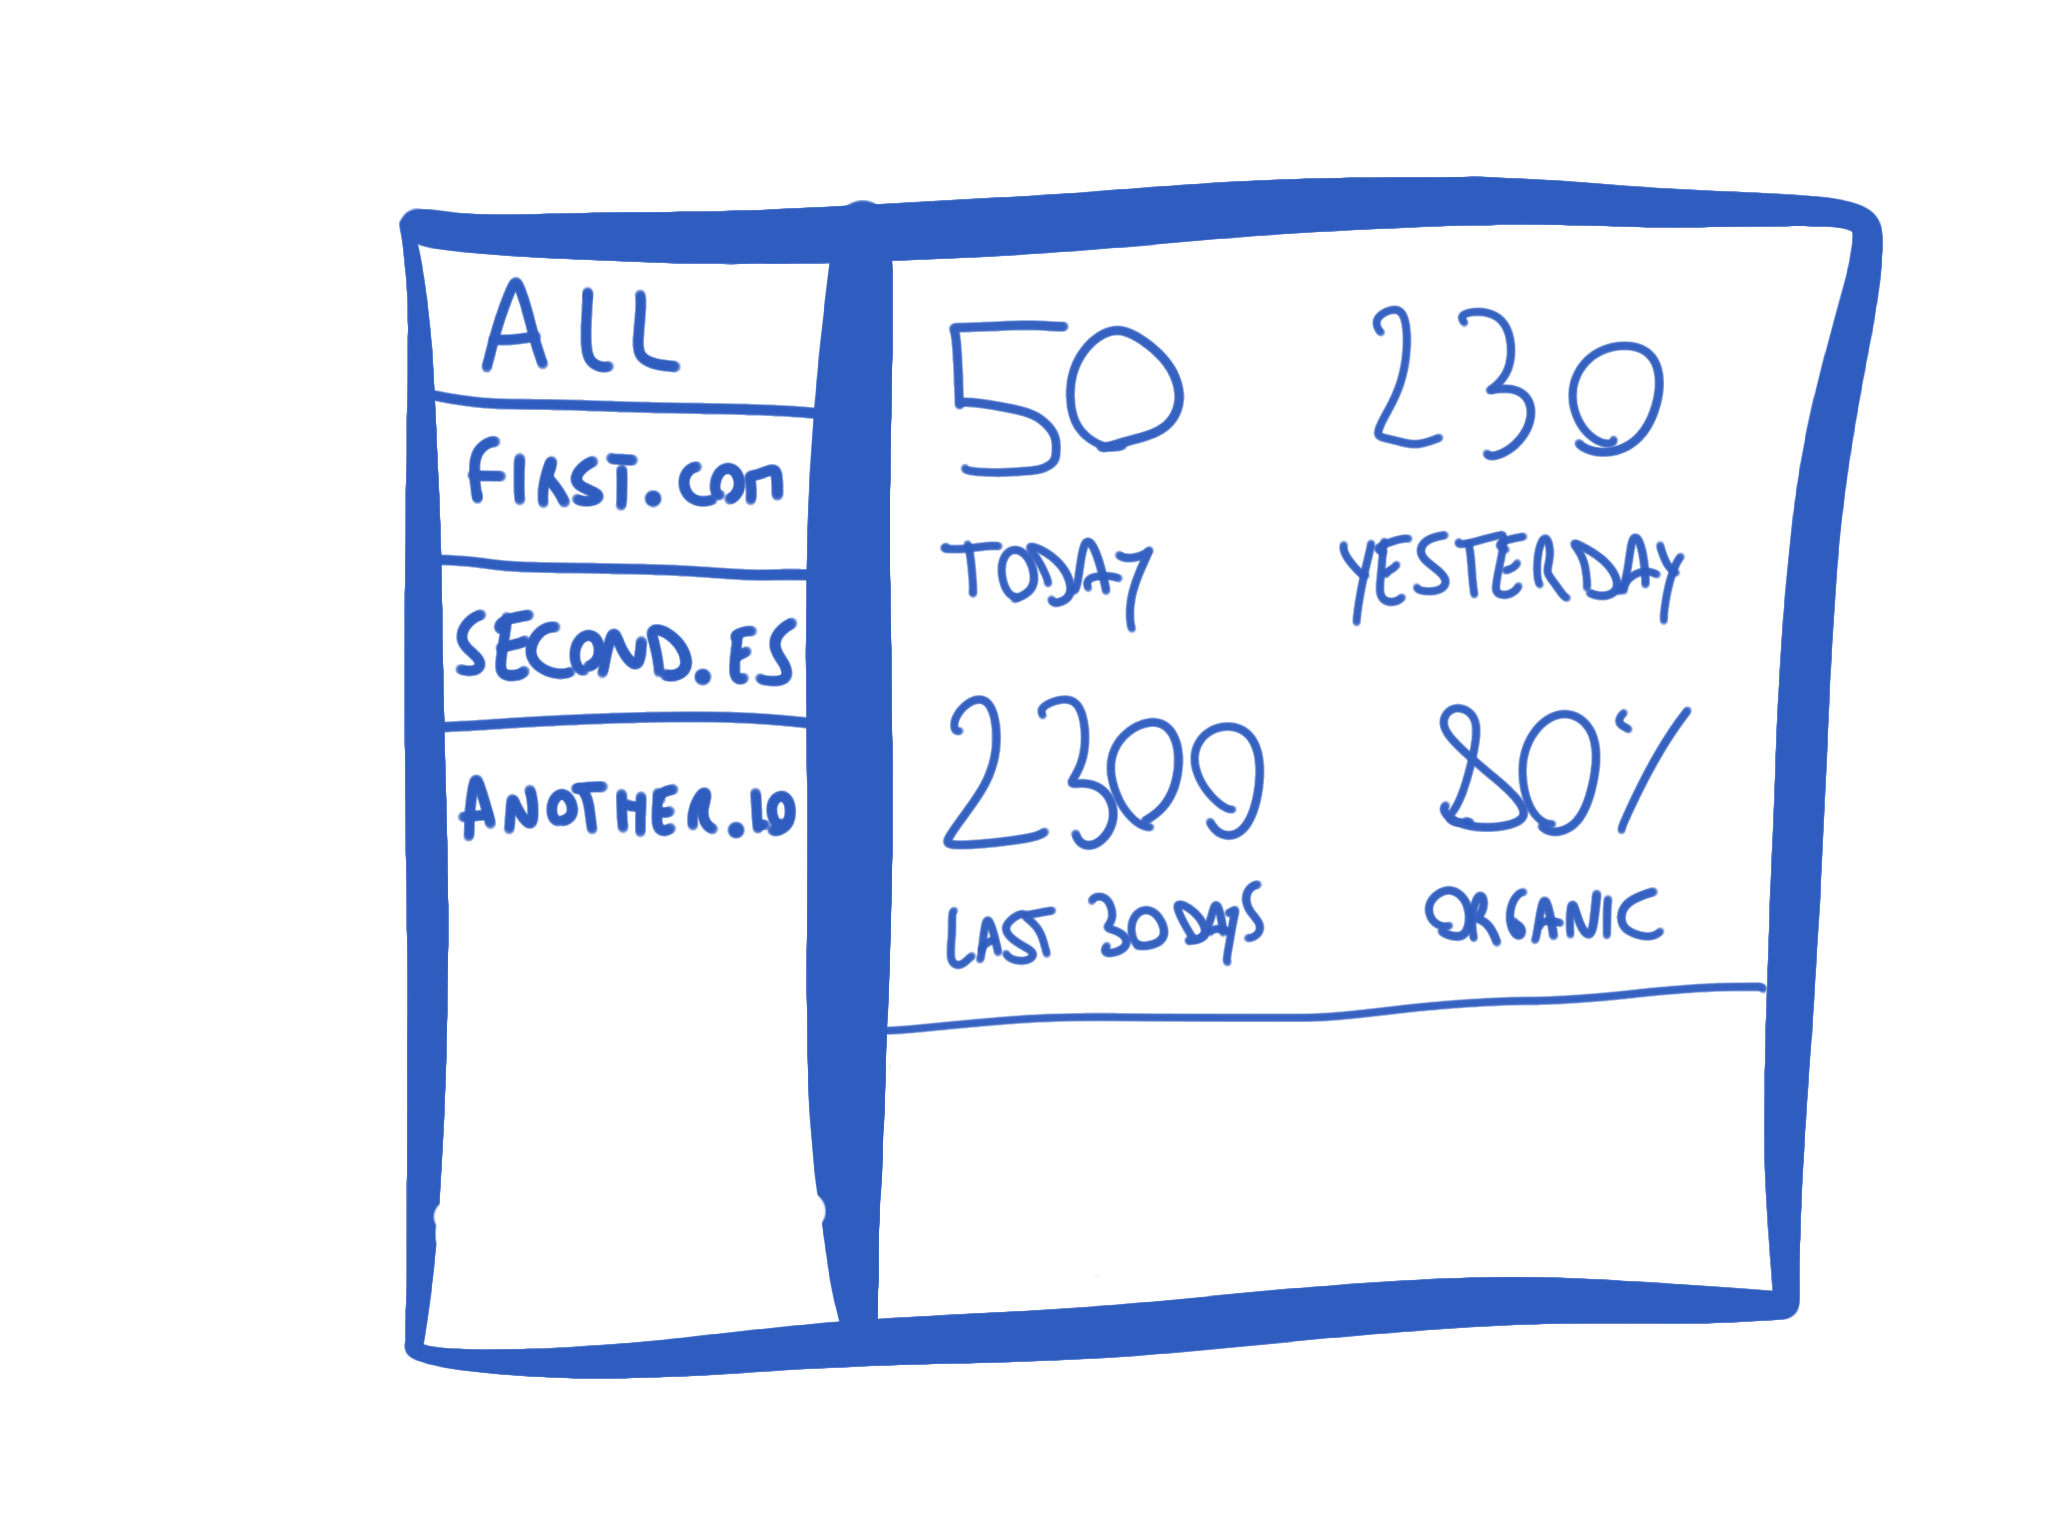
Let’s work on it.
This is not a CSS, design or HTML course, so forgive my poor design skills 😅
First we include create the HTML skeleton, using Pug. To experiment with Pug and see the resulting HTML, I recommend using PugHtml.
This Pug file:
html
  head
    link(rel='stylesheet', href='css/style.css')
  body
    #container
      #sidebar
      #main
        #select
        #stats
          #today
          #yesterday
          #monthly
will generate this HTML
<html>

<head>
    <link rel="stylesheet" href="css/style.css" />
</head>

<body>
    <div id="container">
        <div id="sidebar"></div>
        <div id="main">
            <div id="select"></div>
            <div id="stats">
                <div id="today"></div>
                <div id="yesterday"></div>
                <div id="monthly"></div>
            </div>
        </div>
    </div>
</body>

</html>
We apply this CSS, saving it to public/style.css:
#container {
  width: 800px;
  display: grid;
  grid-template-columns: 30% 70%;
}
#sidebar, #main {
  border: 1px solid lightgray;
  height: 450px;
}
#main {
  display: grid;
  grid-gap: 10px;
}

#select {
  border: 1px solid lightgray;
  height: 60px
}

#stats {
  display: grid;
  grid-template-columns: 33% 33% 33%;
  padding-left: 5px
}

#today,
#yesterday,
#monthly {
  border: 1px solid lightgray;
  height: 170px
}
This will give a nice structure to our page:
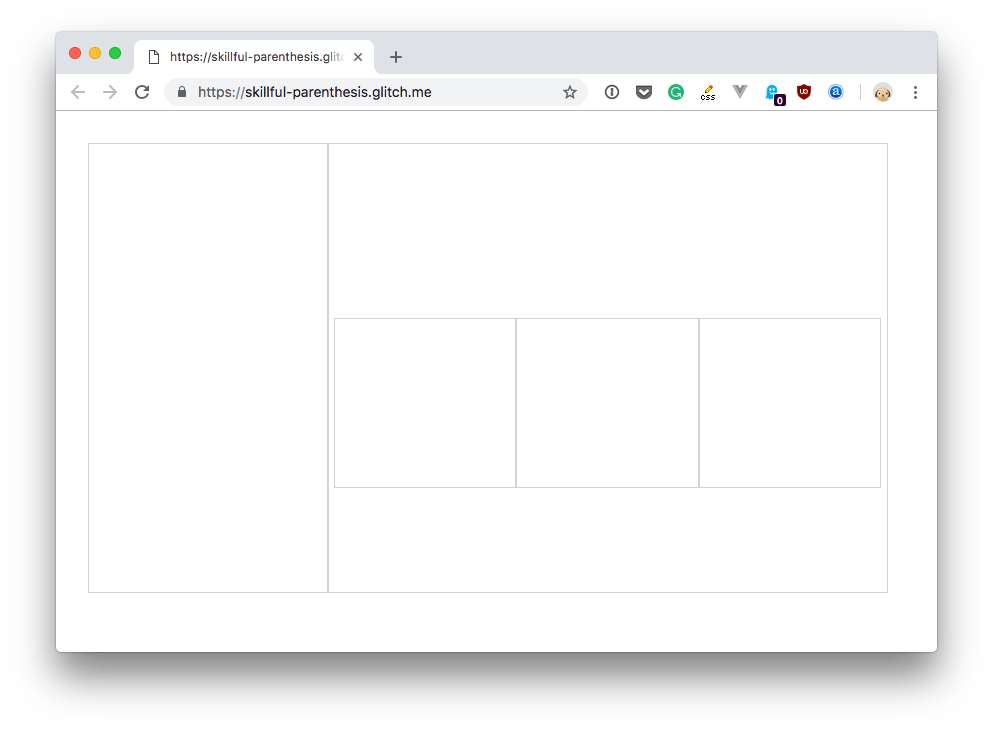
We are now going to fill those boxes with the data.
First, let’s add the list of sites to the sidebar, with an “All” at the top.
We must first add the data to our Pug template. We can do so by passing data in the res.render() function:
app.get('/', (req, res) => res.render('index', data))
Now we can reference each property of the data object in our template.
I mentioned we are going to put an “All” menu at the top, which is the default. However, we don’t sum those numbers yet in the backend.
Let’s do it.
Tweak the getAnalyticsData() method by adding, at the end of it, this snippet:
data.sums = data.aggregate.reduce(( acc, current ) => {
    return {
        today: {
            total: parseInt(current.today.total) + parseInt(acc.today.total),
            organic: parseInt(current.today.organic) + parseInt(acc.today.organic)
        },
        yesterday: {
            total: parseInt(current.yesterday.total) + parseInt(acc.yesterday.total),
            organic: parseInt(current.yesterday.organic) + parseInt(acc.yesterday.organic)
        },
        monthly: {
            total: parseInt(current.monthly.total) + parseInt(acc.monthly.total),
            organic: parseInt(current.monthly.organic) + parseInt(acc.monthly.organic)
        }
    }
  }, {
    today: { total: 0, organic: 0},
    yesterday: { total: 0, organic: 0},
    monthly: { total: 0, organic: 0}
  })
If you are unfamiliar with reduce, it’s a way to transform an array into a single value.
You know map already. Well, reduce is just like map as it iterates an array, but instead of returning a new array, it returns a single element. In this case, we provide an initial value:
{
	today: { total: 0, organic: 0},
	yesterday: { total: 0, organic: 0},
	monthly: { total: 0, organic: 0}
}
and we increment it on every iteration, adding the values of each site analytics to the sum.
The result is the same object, but with the values updated with the counts.
We also add to data the names of the sites, so they are easily accessible in our template:
  data.sites = data.aggregate.map(item => {
    return {
      name: item.property.name,
      id: item.property.id
    }
  })
Now we’re ready to add those values into the Pug template:
html
  head
    link(rel='stylesheet', href='style.css')
  body
    #container
      #sidebar
        ul
          li.active All
          each site in sites
            li= site.name
As you can see we add a loop to iterate the sites property of the data object we passed to the view.
We set the “All” element to have the active class, so we can style it properly later.
Let’s add the data. This is not a frontend course, so we’ll write both organic and total data in the HTML, and show/hide using CSS, defaulting to show total data first.
#main
  #select
  #stats
    #today
      h2 Today
      p.total #{sums.today.total}
      p.organic.hidden #{sums.today.organic}
    #yesterday
      h2 Yesterday
      p.total #{sums.yesterday.total}
      p.organic.hidden #{sums.yesterday.organic}
    #monthly
      h2 Last 30
      p.total #{sums.monthly.total}
      p.organic.hidden #{sums.monthly.organic}
The last pug thing we’ll add now is the links to select to show the total or organic filter:
#main
  #select
    a(class='button total active' href='#') Total
    a(class='button organic' href='#') Organic
We’re done with Pug for now. Let’s switch to some CSS and frontend JavaScript.
CSS, let’s style it
Let’s style the sidebar list, and create a special style if there is the active class on an element:
#sidebar ul {
  padding: 0;
  margin-top: 0;
}

#sidebar li {
  list-style-type: none;
  border-bottom: 1px solid lightgray;
  padding: 20px;
}

#sidebar li.active {
  background-color: gray;
  color: white;
}
Then let’s style the buttons to choose total or organic:
#select {
  width: 300px;
  margin: 0 auto;
  padding-top: 20px;
  text-align: center;
}

#select a {
  padding: 30px;
  color: #666;
}

#select a.active {
  font-weight: bold;
  text-decoration: none;
}
Finally, we hide elements with the hidden class:
.hidden {
  display: none;
}
Frontend JS
In terms of frontend JavaScript we need to do one thing here: when pressing the “Organic” select button, we’ll show the organic numbers.
Otherwise we show the total numbers, which is the default.
To do this, we add the hidden class to all items with the total class, and we remove that class to the organic class elements.
Also, we’ll add the active class the the select link that was clicked, and remove it from the other one. Let’s do it!
If you are a jQuery user, it might be tempting to use it, but we’ll use the native browser APIs instead.
How?
First we listen for the DOMContentLoaded event to make sure the DOM is loaded when we perform our operations.
Then we listen for click events on each of the 2 select button (Total/Organic):
document.addEventListener('DOMContentLoaded', (event) => {
  const buttons = document.querySelectorAll("#select .button")
  for (const button of buttons) {
    button.addEventListener('click', function(event) {

    })
  }
})
Inside this, we first remove the active class from both the buttons, and we add it to the one we clicked:
//...
button.addEventListener('click', function(event) {
  for (const button of buttons) {
    button.classList.remove('active')
  }

  this.classList.add('active')
Then we hide and show the organic or total stats, depending on the class contained in the button:
//...
const organicStats = document.querySelectorAll('#stats .organic')
const totalStats = document.querySelectorAll('#stats .total')

if (this.classList.contains('organic')) {
  for (const item of organicStats) {
    item.classList.remove('hidden')
  }
  for (const item of totalStats) {
    item.classList.add('hidden')
  }
} else {
  for (const item of organicStats) {
    item.classList.add('hidden')
  }
  for (const item of totalStats) {
    item.classList.remove('hidden')
  }
}
Here’s the full code of the JavaScript file:
document.addEventListener('DOMContentLoaded', (event) => {
  const buttons = document.querySelectorAll("#select .button")
  for (const button of buttons) {
    button.addEventListener('click', function(event) {
      for (const button of buttons) {
        button.classList.remove('active')
      }

      this.classList.add('active')

      const organicStats = document.querySelectorAll('#stats .organic')
      const totalStats = document.querySelectorAll('#stats .total')

      if (this.classList.contains('organic')) {
        for (const item of organicStats) {
          item.classList.remove('hidden')
        }
        for (const item of totalStats) {
          item.classList.add('hidden')
        }
      } else {
        for (const item of organicStats) {
          item.classList.add('hidden')
        }
        for (const item of totalStats) {
          item.classList.remove('hidden')
        }
      }

      event.preventDefault()
    })
  }
})
That’s it for now!
You can find the code up to now in https://glitch.com/edit/#!/node-course-project-analytics-dashboard-d.
In the next lesson we’ll add ability to only show the data of a single site, rather than the sum of all visits.